Firstly, I want to be clear, I am not a doctor or a medic, however I am a scientist, a computer scientist. I have spent my life building things with computers to solve problems, and in doing this you get to learn a lot about the world. If you came here looking to hear “Donald Trump solved Covid” or “here is some wonder drug”, I am sorry you are going to be disappointed. I want to talk about something called graph theory and the physics of phase transitions.
Let’s start with some basics, when I say “graph”, I am not talking about a chart of any kind, but a mathematical graph, they look like this:
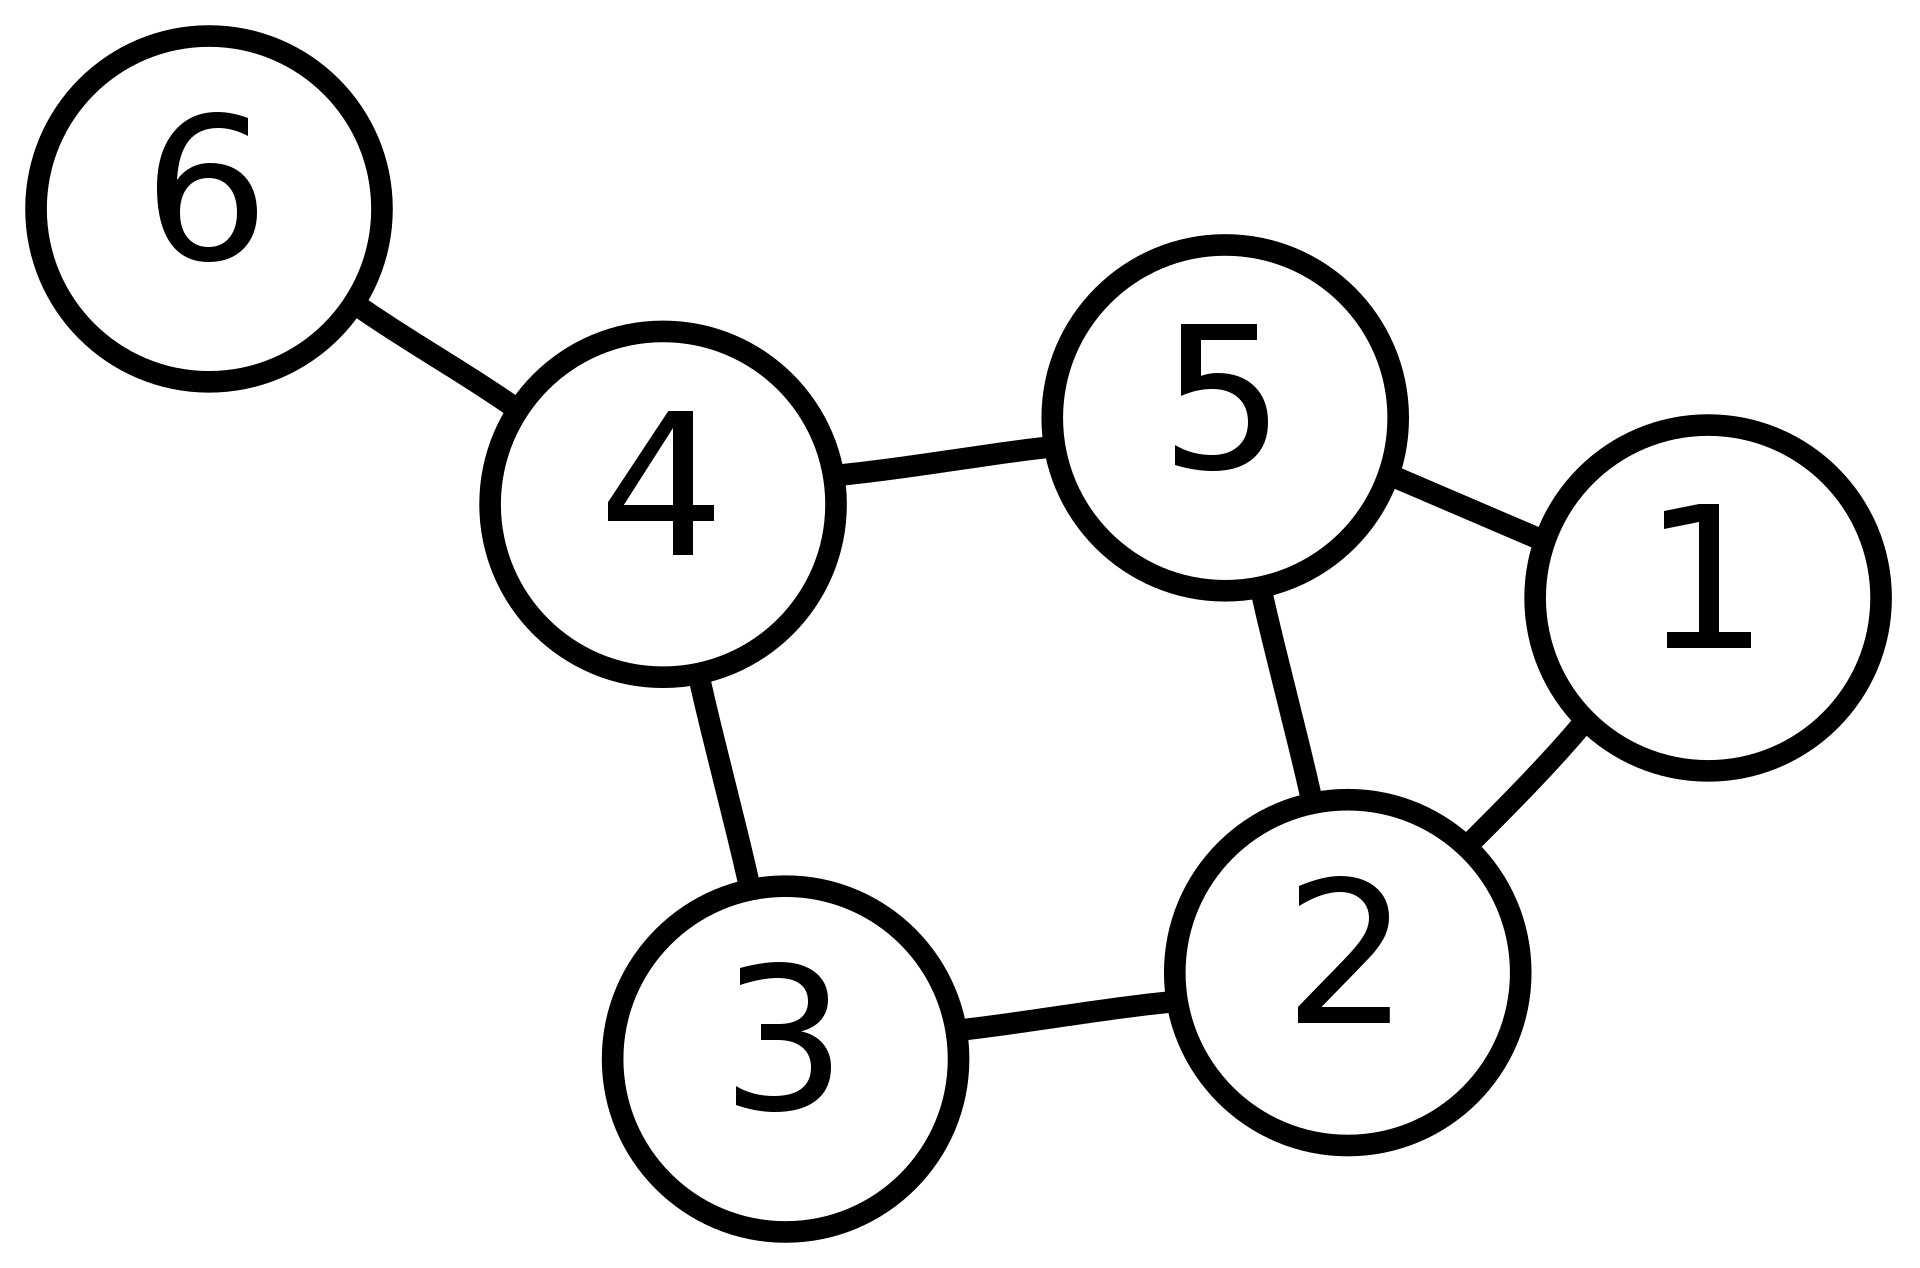
A set of vertices (the points) connected via edges (the lines). You can read a bit more about them online just search for “graph theory”.
Now the structure of the internet can be thought of as a graph, there is a series of computers connected via network links together. The origin of the internet goes back a long time. It was designed as a communications network that could withstand a nuclear war but would still enable the military to communicate. The intention was that if one network link went down, the systems would attempt to route via another link.
There is no central authority that designs the internet, each network provider adds the routers and nodes it needs to function and service their users. This splits the internet into domains for each service provider with various interconnections internally. We would mathematically describe these domains as random graphs, (as the graph lacks a uniform structure). Each of these domains are then connected to form the internet as we know it. The internet is essentially a random graph of random graphs, (a weighted undirected random graph of weighted undirected random graphs if we want to be precise).
Now random graphs are surprisingly common in the world. You may have heard of the idea of the “six degrees of separation”, the idea that you can connect to any other person in the world through a maximum of 6 hops through friends. Your network of friends, contacts and acquaintances is a random graph (again because the graph lacks a uniform structure). There are also games you can play like working out an actor’s “Bacon Index” which is how close someone is to co-starring in a film with Kevin Bacon. Someone who starred in a film with Kevin Bacon gets a Bacon Index of 1. Another actor who starred in a film with actor B where actor B starred in a film with Kevin Bacon gets a Bacon Index of 2 and so on.
One very interesting property of random graphs is how resilient they are, you can drop parts of them out left, right and centre and still easily be able to get from one side to the other. Some estimates suggest that at any point in time 3% of the internet is not functioning, and nobody even notices. The internet very much achieved the early aim of being resilient and able to withstand a nuclear attack. However, as you can imagine, resilience does not last forever. While continually removing parts of it at some point the graph will undergo something called a phase transition. This is a term borrowed from physics, where a process rapidly undergoes a transition from one state to another. An example of this is water boiling, you add heat to water for a period and nothing really happens other than the water gets warmer. However, you get to a point and just a little more heat causes the phase transition and the water boils. When you boil water in a saucepan you do not see the water slowly start moving and then getting faster and faster. You may see the odd air bubble, but that is it, the water stays still. It hits a point then boils, and we see it animatedly jumping around as it boils. The breakdown of a random graph occurs like this too, we keep slowly breaking parts of it, and you can find alternative routes, the basic properties of the graph remain the same. Eventually the graph goes through one of these phase transitions and breaks, it very quickly goes from a functioning graph to a collection of disconnected vertices (it is no longer a graph).
Why is this relevant to Covid? Apart from a joke about Donald Trump I have not mentioned Covid at all. Well, let us think about the transmission of Covid. Covid is transmitted from an infected person to another where the other person is not immune. Kind of like a message going from one computer to another on the internet. We can have outbreaks of Covid in care homes, a specific cafe or pub or a workplace. These are very much like the structure of the internet, there is a specific set of people going to care homes, but between these contacts there is no structure (a worker can be in touch with 50 people, an elderly resident may only be in contact with a handful). The network of people going to a care home is a random graph much like say BT’s bit of the internet infrastructure. Maybe a person who picks up Covid in a care home then goes to a cafe or a supermarket (another random graph) and passes it on, much like the random graph of random graphs structure of the Internet.
So why is this relevant? Well, it is all about the reliability of random graphs, at any one time 3% of the internet is down and nobody notices, so 3% of the population could be immune to Covid and it would have no effect (other than to the individuals immune). The bigger point to make is how resilient the transmission of Covid could be to vaccination. On the negative side, this means we would need to make a lot of people immune before there was any real impact. On the positive side, we could expect the graph of infections to go through the same phase transition that the breaking of the internet could go through once enough immunity is reached to break the graph, the pandemic should rapidly end.
Now this thought came to me as I was walking to the shops on Monday 19th July 2021, it is now Saturday 24th July. Today the UK government has announced 31,795 new positive tests, a week ago it was 54,674. That is a drop of nearly 23,000 cases in a week (positive tests per day). At no point in the pandemic have we seen the cases increase at the rate we are now seeing them decrease, (previously the decrease was always much slower than the increase). This is following a hugely successful rollout of the vaccination in the UK. On the same day (24 July) 88% of the population have had one dose of the vaccine and 69.9% have had their second dose. With the number of people who have some degree of natural immunity adding to this, a very significant percentage of the population will now be immune.
Now I am not a medical professional, but could the internet and a little bit of physics now be telling us that the pandemic in the UK is beginning to end?
As the first person to mark you down Scott, I feel obliged to explain why. Your exposition of the theory of graphs and breakdown thereof is a fresh slant on the issue and well made, But I wish you hadn’t been put off by your lack of medical training from investigating further. I too have no medical training (but I am human and I nurture my immune system, so I’m not entirely ignorant). I also underwent a very rigorous grounding in the matter of statistics when I was at college, and I am appalled at the obvious massaging of the… Read more »